Mortgage Activity Softens as Refinance Volume Plummets
News related to:Optimal Blue · 3 min read
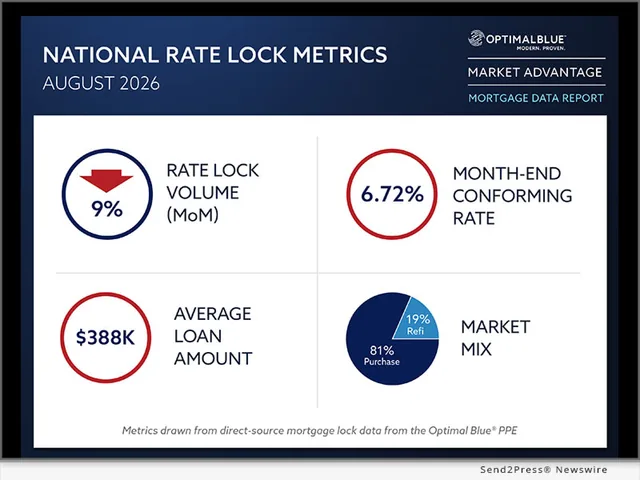
PLANO, Texas, Sep 08, 2026 /CourierPR/ -- Optimal Blue, a leader in mortgage capital markets technology, released its August 2026 Market Advantage mortgage data report, revealing a softening in mortgage activity despite stable interest rates. According to the report, total rate-lock volume declined 9% month over month (MoM) and dropped 3% below the levels seen in August 2025. Purchase lock volume fell 10% from July, but remained 6% higher year over year (YoY), accounting for nearly 81% of total lock volume.
Refinance activity showed a significant pullback, with rate-and-term refinance volume declining 47% YoY and 13% MoM. The share of total production that was refinancing ended the month at more than 19%, but the sharp decline in rate-and-term refinance volume suggests a slowdown in overall mortgage demand. Cash-out refinance volume fell 3% MoM and 5% YoY, further indicating a less active market.
Interest rates saw little change across major products in August. The Optimal Blue Mortgage Market Indices (OBMMI) 30-year conforming fixed rate, a key benchmark, remained at 6.72%, unchanged from July but 28 basis points (bps) higher than three months ago and up 23 bps YoY. The 10-year Treasury yield also held steady at 4.75%, and the spread between the 10-year Treasury and the OBMMI 30-year conforming rate was unchanged at 197 bps, nearly 30 bps tighter than a year ago. Brennan O'Connell, director of data solutions at Optimal Blue, commented, "After a sharp move higher in July, rates leveled off in August, but that pause didn't translate into stronger volume. Purchase activity is still running ahead of last year, but with rate-and-term refinance volume down 47%, there just isn't much refinance demand to support the broader market."
On the secondary market side, execution spreads tightened across most major products. The best-efforts-to-mandatory spread for conventional 30-year loans narrowed 4 bps to 26 bps, and the 15-year spread narrowed 3 bps to 37 bps. Mortgage servicing rights (MSRs) for conforming 30-year loans increased 4 bps to 1.38%, a 5.52 multiple. The share of loans sold at the highest price tier declined from 79% to 77%, while the share of loans sold with servicing retained increased 4 percentage points to 57%, rebounding from 53% in June and July.
The report also highlighted that conforming loans lost ground, accounting for 47% of total production, down 38 bps MoM and more than 4 percentage points YoY. Non-conforming loans held steady at nearly 21%, while FHA loans increased 74 bps to nearly 20%, and VA loans declined 44 bps to nearly 12%. Non-qualified mortgages (non-QMs) accounted for more than 11% of total lock volume in August, up 1 percentage point MoM and 3 percentage points YoY.
Adjustable-rate mortgages (ARMs) accounted for 10.5% of lock volume in August, down 55 bps MoM but remaining slightly above year-ago levels. The property mix remained stable, with single-family detached homes accounting for more than 63% of production. Planned unit developments (PUDs), a proxy for new-construction activity, represented more than 28% of volume, down 51 bps MoM but still 49 bps higher YoY. Condominiums accounted for 6% of production, and manufactured housing nearly 2%.
The OBMMI 30-year conforming fixed rate is forecast to rise, then ease over the next year. The rate is projected at 6.74% over the next month and 6.82% over three months before easing to 6.51% over the next 12 months. The primary-secondary spread is expected to narrow from 1.09% currently to 1.04% over the next month and 1.03% over three months before returning to 1.04% over the next 12 months.
Hedged sales shifted toward mortgage-backed securities (MBS), with the share of hedged loan sales delivered via MBS increasing 300 bps MoM to 43%. Bulk executions declined 1 percentage point MoM to 24%, cash executions held at 32%, and best-efforts executions declined 1 percentage point MoM to 2%. The share of a lender's pipeline eligible for specified pool delivery remained at 80% in August. The share of loans originated in New York, Florida, Texas, or Puerto Rico increased 31 bps MoM, while the $350,000 unpaid principal balance (UPB) tier declined 29 bps.
The UM30 5.5 hedge share eased, accounting for 62% of hedges in August, down from 67% in July. That compares with 27% of production slotting into the 5.5 coupon and 25% into the 6.0 coupon. The share of loans sold with servicing retained increased 4 percentage points MoM to 57%, up from 53% in June and July.
First-time homebuyer share was unchanged MoM across conforming, FHA, and VA loans. Purchase debt-to-income (DTI) ratios were unchanged